Spatial data can be captured and represented in two formats:
- Vector: Most maps featuring distinct points, lines or polygons fall under vector data within a set coordinate system that are typically based on latitudes and longitudes or a projected system consisting of northings and eastings. Vector data is useful in mapping real life objects such as trees (as points), roads and rivers (as lines) and buildings and lakes (as polygons) for accurate depiction of the extent.
- Raster: All data gathered through images falls under raster data. In this cases, the data is stored in form of pixels which in turn are dependent on the resolution of the image capturing device. Higher resolution leads to more pixels and thus more detailed data gathering. The information is stored in terms of X, Y, and Z values on each pixel and features are detected based on similar values. Raster data can create significant errors in values if the resolution is not high enough and delineating exact boundaries of objects becomes difficult. However, it is useful in creating digital elevation models (DEMs) and has higher compatibility with remotely sensed data.
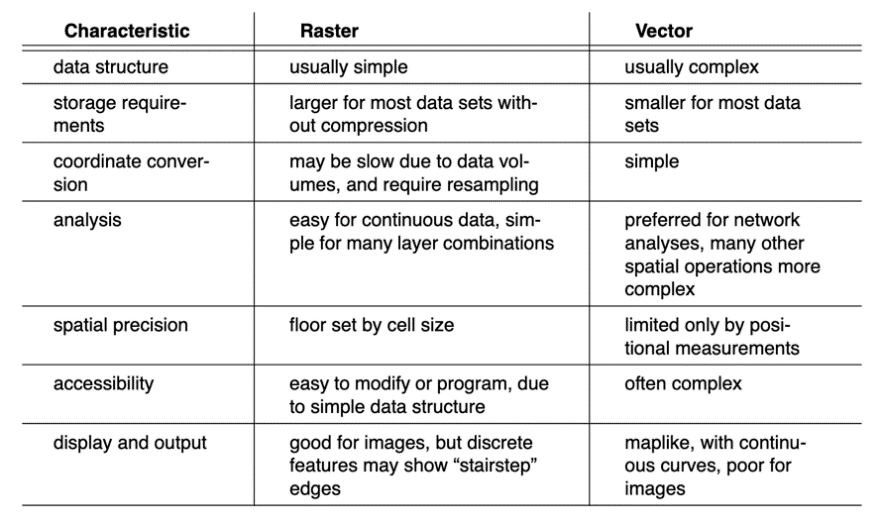
A big advantage of GIS is that it allows you to utilise and combine both, vector and raster data in order to run accurate analyses, e.g., a raster image of a flood can be mapped on a map of a city or a neighborhood to quickly understand the extent of the flood. Similarly, such data from previous years can be analysed together to forecast flooding and design flood shelters and flood mitigation structures, etc. A summary of the characteristics and visual representations of Raster Data Model vs Vector Data Models are presented in Figures 1 and 2.
Table 1. Raster Data Model vs Vector Data Model. Source: Bolstad (2016)
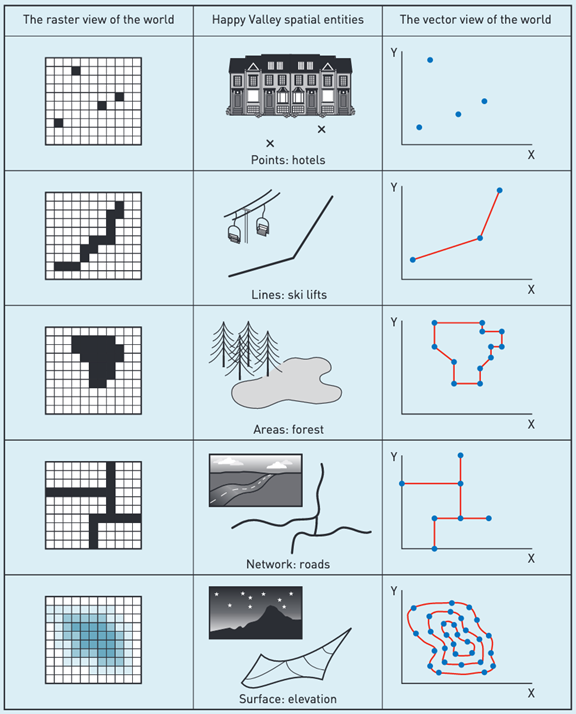
Figure 2. Raster Data Model vs Vector Data Model (ii) (source: Heywood, Cornelius and Carver, 2011)
 Tool -